The four levers that fix most 3D SCADA performance problems are model optimisation (convert to GLB, compress with Draco and KTX2), draw call reduction through mesh merging and instancing, event-driven telemetry instead of aggressive polling, and hardware validation during Factory Acceptance Testing. Platforms built for this from the ground up, including Kingfisher 3D SCADA, bake several of these practices into the workflow already. Start today: run an optimisation pass on your heaviest scene and measure the frame time difference before touching anything else.
TL;DR:
- Optimizing models with GLB conversion, mesh merging, decimation, and compression significantly reduces file size and improves scene responsiveness.
- Reducing draw calls through mesh instancing and merging is the most effective way to improve frame rates in scenes with many repeated objects.
- Using event-driven telemetry and batching data updates prevents CPU overload caused by tag polling, which can severely impact performance during alarm storms.
- Building hardware checks into Factory Acceptance Tests ensures scene complexity matches the available GPU and memory capacity, avoiding bottlenecks.
- For large datasets, spatial partitioning, occlusion culling, and asynchronous loading help maintain smooth navigation and reduce memory usage across extensive plant models.
Table of Contents
- Performance levers: what most commonly drags down frame rate and responsiveness
- Model optimisation workflow: convert to GLB, clean, simplify, compress, and export with LODs
- Runtime architecture and hardware: matching scene complexity to GPU and browser constraints
- Telemetry and data-binding: avoid tag storms and unnecessary polling
- Testing and monitoring: FAT checklist and runtime guards
- Handling and optimising large-scale spatial datasets within 3D SCADA
- Strategies for network optimisation to reduce data latency and bandwidth usage
- Common performance bottlenecks in 3D SCADA systems and their mitigation
- Balancing visual fidelity with performance for different user hardware capabilities
- Security implications of performance tuning in 3D SCADA environments
- Why visual clarity should trump photorealism in industrial HMIs
- Getting a fast, no-code 3D SCADA scene live without a rendering specialist on staff
- Sources
- FAQ
Performance levers: what most commonly drags down frame rate and responsiveness
Every laggy 3D SCADA scene traces back to a handful of repeat offenders. Draw calls (the number of separate instructions the GPU processes per frame) climb fast when a scene has hundreds of unmerged meshes, each demanding its own render pass. VRAM pressure builds when texture sizes outstrip what the graphics card can hold, forcing constant swapping. Shader complexity, dynamic lighting, and post-processing effects like bloom or ambient occlusion all add GPU cost that industrial hardware rarely has to spare.
The trap most teams fall into is decorative complexity. A photorealistic pump room with eight dynamic lights and 4K textures looks impressive in a demo and grinds to a halt on a panel PC running a real shift.
Fix things in this order:
- Reduce draw calls first, through merging and instancing.
- Cap texture budgets before touching lighting.
- Simplify shaders and post-processing last, once geometry and textures are under control.
- Re-test frame time after each change, not after all of them at once.
Pro Tip: If you can't tell which lever is hurting you, disable post-processing entirely for one test run. If frame time barely changes, your bottleneck is geometry or textures, not lighting.
Model optimisation workflow: convert to GLB, clean, simplify, compress, and export with LODs
GLB is the format to standardise on for browser-based 3D SCADA. It packages geometry, textures, and materials into a single file, which avoids the missing-companion-file errors that plague OBJ or FBX exports and works consistently in browser-based viewers.
The pipeline that consistently produces clean, fast assets runs like this:
- Repair geometry. Fix non-manifold edges and flipped normals before anything else.
- Strip unused data. Remove orphaned materials, unused UV channels, and hidden geometry.
- Merge meshes by material. Fewer materials mean fewer draw calls downstream.
- Generate LODs. Build two or three levels of detail for anything viewed at variable distance.
- Decimate where needed. Reduce triangle count on background or rarely-inspected assets.
- Bake normals and ambient occlusion into textures if you're simplifying high-detail source meshes.
- Compress geometry with Draco, then compress textures with KTX2 or WebP.
An optimisation pipeline built on GLB, Draco, and KTX2 or BasisU commonly reduces geometry and texture size substantially while keeping visual fidelity intact for real-time use. Toolchains like 3D-Model-Optimizer bundle these steps into fast, balanced, and maximum presets.
| Preset | Best for | Trade-off |
|---|---|---|
| Fast | Panel PCs, mobile tablets | Lower fidelity, fastest load |
| Balanced | Desktop browsers, most control rooms | Good visual quality, moderate file size |
| Maximum | Hero assets viewed up close | Largest file size, slowest load |
Always verify visually after each major change. Run a scripted check at typical operator camera distances to confirm decimation hasn't stripped a valve handle or gauge marking someone actually relies on.
Runtime architecture and hardware: matching scene complexity to GPU and browser constraints
Integrated GPUs struggle with anything beyond simple geometry, and industrial guidance generally recommends discrete GPUs for demanding 3D scenes, particularly where operators expect smooth camera movement across a full plant model. Panel PCs with integrated graphics can technically render a scene and still fall well short of a usable frame rate once telemetry overlays and alarm animations stack on top.
Build hardware checks directly into your FAT protocol:
- Confirm available VRAM against your heaviest scene's texture load, not an average one.
- Verify browser GPU support, including WebGL2 and the ANGLE or DirectX runtime the deployment browser uses.
- Test CPU concurrency under a simulated tag storm, not just idle load.
- Measure frame time during peak alarm bursts, not just steady state.
If hardware is fixed and underpowered, LODs and progressive texture loading buy you headroom without a hardware refresh. Progressive loading, where the scene renders low-detail geometry immediately and streams higher detail in afterward, keeps the interface responsive even on modest panel PCs. Server-side render proxies are worth considering for legacy terminals that can't run modern WebGL reliably at all.
Telemetry and data-binding: avoid tag storms and unnecessary polling
Data binding, not the GPU, is where a surprising number of "3D performance" complaints actually originate. Polling hundreds of tags every 100 milliseconds or faster overloads the CPU well before it stresses the graphics pipeline, and frame rate suffers as a side effect of a data problem rather than a rendering one.
The fix is architectural, not cosmetic:
- Use event-driven updates for critical tags, so the interface only redraws when a value genuinely changes.
- Set sensible polling intervals for low-priority tags, measured in seconds rather than milliseconds.
- Filter and aggregate tag updates before they hit the render loop, and apply threshold deltas so trivial fluctuations don't trigger redraws.
- Batch updates rather than pushing them one at a time.
- Push telemetry over WebSocket streams for high-throughput data instead of relying on constant polling.
Pro Tip: If your scene stutters exactly when an alarm storm hits, the problem is almost always tag update volume, not geometry. Check your polling interval before you touch a single 3D model.
Testing and monitoring: FAT checklist and runtime guards
A Factory Acceptance Test that skips performance under load is not a complete FAT. Build it around these checks:
- Measure frame time under normal tag update rates, then again under a simulated peak load.
- Profile VRAM and system memory across a full operator shift, not just a five-minute demo.
- Count active draw calls per scene and flag anything that jumps unexpectedly after an asset update.
- Run a degraded-mode test with a reduced asset set to confirm graceful fallback rather than a crash.
- Stress-test the browser itself, since main-thread time spent parsing telemetry can exceed budget even when the GPU is barely working.
Once live, track average frame time, 95th percentile frame time, VRAM usage, draw-call count, and telemetry queue length continuously. A growing queue of dropped updates is often the earliest warning sign of a regression, well before anyone notices visual lag. Version every asset change, run automated smoke tests against known-good scenes, and keep a documented rollback path so a bad deployment never sits in production overnight.
Handling and optimising large-scale spatial datasets within 3D SCADA
Plant-wide digital twins routinely involve tens of thousands of individual components across multiple buildings or process areas, and loading all of it at once is rarely necessary or wise. Spatial partitioning, splitting the model into zones or floors that load on demand as the operator navigates, keeps memory usage proportional to what's actually visible rather than the size of the entire facility.
Occlusion culling helps here too: geometry behind walls or outside the current camera frustum doesn't need to be processed, let alone rendered. Combine that with distance-based LOD switching so a tank farm viewed from a plant-wide overview renders as simplified blocks, then swaps to detailed geometry only once an operator zooms in.
For genuinely large datasets, streaming architectures that load spatial chunks asynchronously in the background prevent the jarring full-scene freeze that happens when a monolithic model tries to load in one hit. Point cloud or scan-derived data benefits particularly from aggressive decimation early, since raw scan meshes carry far more triangle density than any operator interface actually needs. Tag the dataset with metadata that lets the rendering engine prioritise load order by operational relevance, so control rooms and high-traffic zones populate first while peripheral areas stream in afterward.
Strategies for network optimisation to reduce data latency and bandwidth usage
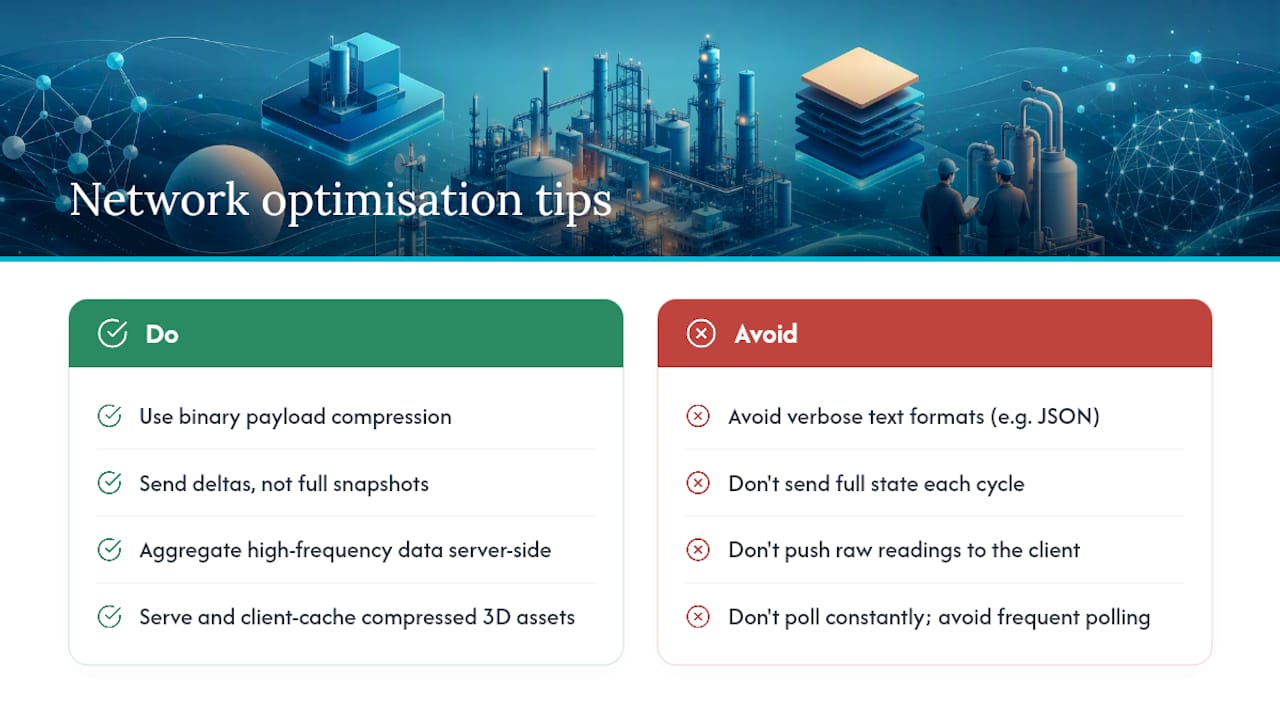
Bandwidth waste on a 3D SCADA deployment usually comes from sending more data than the interface can actually use, not from network capacity itself. Compressing telemetry payloads with binary protocols instead of verbose text formats cuts bandwidth substantially, particularly across sites connecting over a factory Wi-Fi network or a constrained industrial link.
Delta encoding, where only changed values transmit rather than a full state snapshot each cycle, reduces payload size dramatically on tag sets where most values stay static between updates. Pair that with server-side aggregation so raw high-frequency sensor data gets summarised before it ever reaches the browser, rather than pushing every individual reading to the client for it to filter locally.
Content delivery for 3D assets matters just as much as live telemetry. Serving compressed GLB files from a location close to the deployment site, and caching them client-side after first load, avoids re-downloading multi-megabyte scenes every session. For remote or multi-site deployments, prioritise push-based delivery over constant client polling wherever the underlying protocol supports it. WebSocket connections that push updates only when values change put far less strain on the network than a client polling a server every few hundred milliseconds regardless of whether anything actually happened.
Common performance bottlenecks in 3D SCADA systems and their mitigation
Most performance complaints trace back to one of five recurring problems, and diagnosing which one you have determines the fix.
Too many draw calls shows up as low frame rate even on simple-looking scenes. Merging static meshes and using instanced rendering for repeated objects fixes this reliably, especially where a facility has dozens of identical pumps, sensors, or racking units rendered as separate meshes instead of one instanced asset.
Texture memory overload causes stutter and, in severe cases, browser crashes. This is almost always solved by enforcing a hard texture size cap, commonly 1024×1024 for most industrial assets, and compressing everything with KTX2.
Tag storm overload looks like a rendering problem but is a data problem, as covered above. Unoptimised geometry, meaning models exported straight from CAD without cleanup, carries triangle counts far beyond what's needed for an operator interface.
Main-thread contention is the quiet one: a scene can be GPU-light and still miss its frame budget because telemetry parsing and DOM overlay updates are eating CPU time the renderer needed. Offloading parsing to a background worker thread resolves this without touching a single 3D asset.
Balancing visual fidelity with performance for different user hardware capabilities
A single 3D SCADA scene rarely needs to look identical on a control room workstation with a discrete GPU and a maintenance technician's tablet on the plant floor. Designing for the lowest common hardware in your fleet, and adding fidelity for capable devices, works better than the reverse.
Adaptive quality settings, where the platform detects available VRAM and browser GPU features at load time and serves the fast preset automatically to weaker hardware, remove the burden of manual configuration from operators who shouldn't need to think about it. LODs handle the middle ground: a tablet gets simplified geometry at range and full detail only when an operator zooms into a specific asset, keeping the interface responsive without a visibly worse experience.
The mistake worth avoiding is treating visual fidelity as a fixed target applied uniformly across every device. A control room display running on a dedicated workstation can carry the balanced or maximum preset without issue. A shared tablet checked out from a locker for one shift needs the fast preset every time, regardless of how good the desktop version looks. Building that distinction into your deployment from day one saves a lot of after-the-fact troubleshooting when a technician reports lag that never shows up on the engineer's own machine.
Security implications of performance tuning in 3D SCADA environments
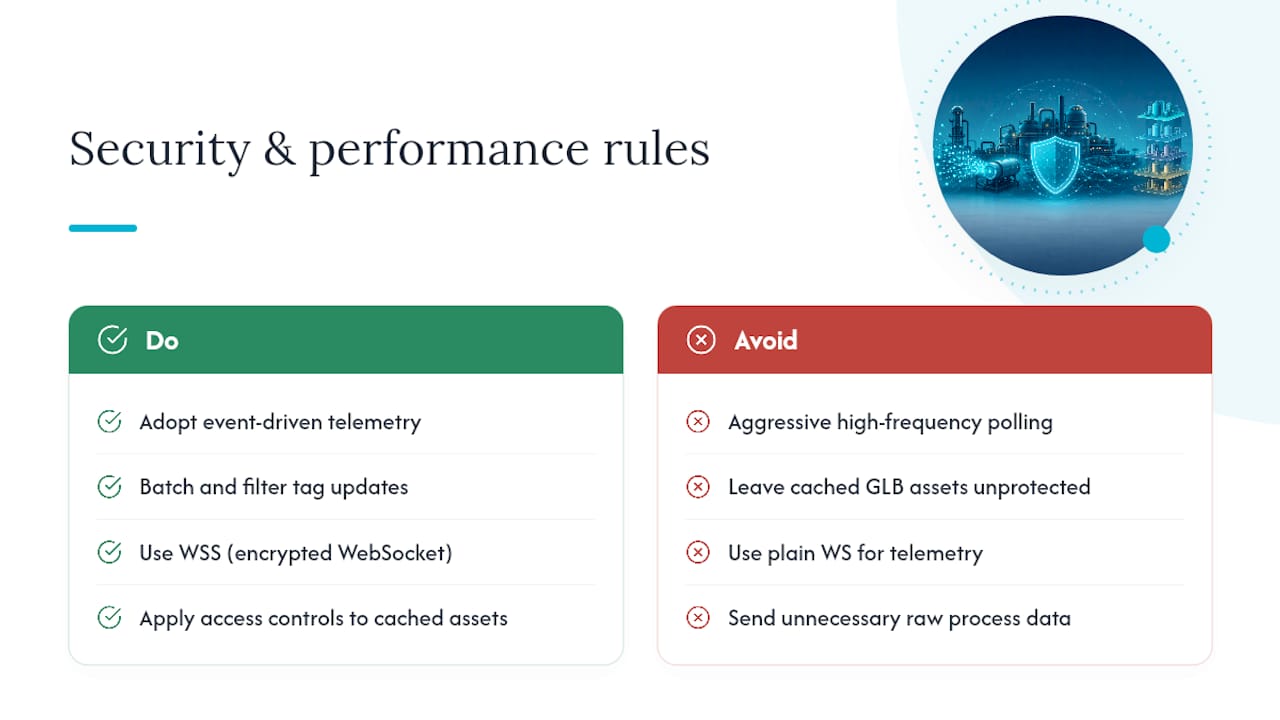
Performance tuning and security aren't separate concerns in a 3D SCADA deployment. Aggressive polling intervals don't just strain the CPU, they also widen the attack surface by keeping more network connections open and active than necessary, each one a potential point of interception on an industrial network.
Event-driven telemetry, adopted for performance reasons, has a security benefit too: fewer, more deliberate data transmissions are easier to monitor for anomalies than a constant high-frequency stream where an unusual burst can hide in the noise. Batching and filtering tag updates before transmission also reduces how much raw process data travels across the network in a form that could be intercepted.
Caching optimised GLB assets client-side speeds up load times, but cached assets need the same access controls as the live system. A cached scene sitting unprotected in a browser's local storage on a shared terminal is a real exposure point, particularly on tablets or kiosks accessible to more people than the control room itself. WebSocket connections used for push-based telemetry should run over encrypted channels (WSS, not plain WS) as standard practice, not as an optional hardening step applied later. None of this should be treated as a trade-off against speed. A well-architected telemetry layer is faster and more secure at the same time, because the same discipline, sending only what's needed, when it's needed, achieves both.
Why visual clarity should trump photorealism in industrial HMIs
Most 3D SCADA scenes fail operators not because they're slow, but because they're trying too hard to look real. An operator scanning a control room display needs to spot an abnormal valve state in under two seconds, and heavy shadows or reflective materials work against that, not for it.
Invest optimisation effort where it earns readability: clean geometry, clear colour coding, instant alarm visibility. When a scene still feels sluggish after a proper optimisation pass, the fix is often a redesign, not another compression round. Run the FAT checklist, then sit with your operations team and watch how they actually use the screen before deciding what's worth rendering at all.
— Jeffrey Anastacia
Getting a fast, no-code 3D SCADA scene live without a rendering specialist on staff
Most of the optimisation work above, GLB conversion, Draco and KTX2 compression, LOD generation, still needs someone who understands 3D pipelines to execute manually. Some platforms remove that dependency by offering no-code, browser-based drag-and-drop scene building and AI-powered scene generation from schematics or photos to handle most of the modelling work traditional 3D SCADA projects require a specialist for.
The built-in marketplace ships with over 1,000 ready-made 3D and 2D components, already optimised, which sidesteps a huge chunk of the model cleanup and compression work covered in this playbook. Add real-time protocol drivers for live data integration, and you get a scene that's performance-conscious by default rather than by afterthought.
If you're carrying a heavy legacy scene right now, the practical next step is to run an optimisation pass on your worst-performing model, then trial it inside a Starter licence at $4,250 USD one-off per PC. Test it against the FAT checklist above before committing to a Pro or Enterprise rollout across the wider site.
Sources
Start with a GLB web optimiser for quick compression, the 3D-Model-Optimizer toolchain for scripted pipelines, and Kingfisher's 3D SCADA platform overview for a no-code deployment route.
- 3D Graphics in HMI/SCADA Systems: Platforms, Setup, and Performance – Industrial Monitor Direct
- 3dugc/3D-Model-Optimizer
- 3D Web & AR Optimizer - Free online | FileOven
FAQ
What Is 3D SCADA?
3D SCADA is supervisory control and data acquisition software that renders plant equipment and processes as an interactive 3D digital twin instead of flat 2D symbols. It combines real-time telemetry with spatial visualisation, letting operators navigate a virtual replica of a facility rather than a static schematic.
What File Format Gives the Best 3D SCADA Performance?
GLB is the preferred runtime format because it packages geometry, textures, and materials into one file, which works consistently across browser-based viewers without missing dependencies. Pairing GLB with Draco geometry compression and KTX2 texture compression gives the best size-to-quality trade-off for web delivery.
How Do I Reduce Draw Calls in a 3D SCADA Scene?
Merge static meshes that share a material into single objects, and use instanced rendering for any asset that repeats many times across a scene, such as pumps, sensors, or racking. This cuts CPU-side overhead significantly compared to rendering each duplicate as a separate object.
What Texture Resolution Should I Use for Industrial 3D SCADA Scenes?
A practical cap of 1024×1024 works for most industrial assets viewed at typical operator distances, with higher resolution reserved only for hero assets inspected up close. Compressing textures with KTX2 keeps file size low while preserving enough detail for clear identification of equipment.
Does Kingfisher 3D SCADA Handle Model Optimisation Automatically?
Kingfisher's no-code, browser-based platform reduces the manual optimisation burden through AI-powered scene generation and a marketplace of over 1,000 pre-built, ready-to-use components. Pricing runs from a Starter licence at $4,250 USD one-off per PC, with Pro and Enterprise tiers available for larger deployments.