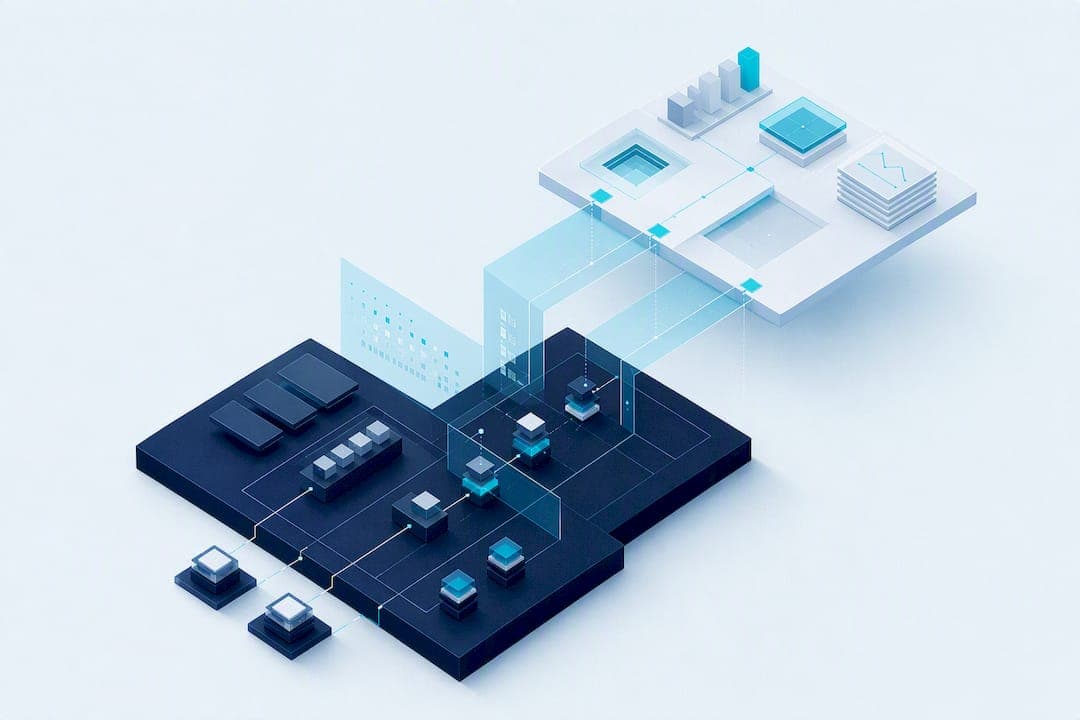
SCADA gives you the raw signals: machine states, cycle counts, alarms. It was never built to model losses, so relying on it alone for OEE usually produces numbers nobody trusts. The fix is a decoupled analytics layer fed by SCADA, running on OPC UA where possible, backed by a historian or unified namespace, with timestamps synchronised across every source. Kingfisher 3D SCADA is one example of a platform built for that kind of rapid modelling and live visualisation.
TL;DR:
- Reliable OEE calculation requires synchronized timestamps across all data sources, especially on fast equipment where micro-stoppages can change results by several percentage points.
- Using a dedicated analytics layer fed by OPC UA or a unified namespace helps maintain accuracy and scalability without slowing control loops.
- Validating automated OEE against manual logs over multiple shifts ensures drift stays under about 1%, which is necessary before trusting the data for decision-making.
- High-speed sample rates, like one second instead of five, uncover micro-stoppages that significantly impact OEE and often reveal underlying issues missed at slower rates.
- No-code visualization tools like Kingfisher 3D SCADA facilitate rapid deployment and real-time visual feedback, reducing modeling time from weeks to days and supporting effective continuous improvement.
Table of Contents
- SCADA versus OEE monitoring software: different jobs, different users
- Building the data architecture: protocols, historians and tag structure
- A step by step checklist from discovery to go live
- Validation, pitfalls, and keeping OEE data auditable
- An example of real-time OEE visualisation done well
- How SCADA-fed OEE data changes maintenance and scheduling
- Choosing between SCADA plus analytics and a dedicated OEE platform
- Evaluating Kingfisher 3D SCADA for your OEE rollout
- Where these recommendations come from
- Sources
- FAQ
SCADA versus OEE monitoring software: different jobs, different users
SCADA exists to control equipment and show operators live state: is the line running, is an alarm active, what's the current setpoint. It was built for split-second decisions on the plant floor, not for explaining why a shift lost four hours of output. SCADA supplies the raw signals that make OEE possible, but the analysis itself belongs to a dedicated layer designed for availability, performance and quality breakdowns.
OEE monitoring software takes those same signals and turns them into loss categories: changeover time, minor stops, speed loss, scrap. Operators live in SCADA screens. Continuous improvement teams and production managers live in OEE dashboards, drilling into root causes and comparing shifts, lines, or plants.
A SCADA-only dashboard can work for a slow, low-mix line where downtime is rare and obvious. It falls apart once you need:
- Sub-second visibility into micro-stoppages on high-speed equipment
- Defensible, auditable numbers for customer or regulatory reporting
- Cross-line or cross-site comparisons using consistent loss definitions
Push OEE logic into the SCADA server on a fast line and you risk slowing the very control loop you need to stay responsive. Keep the two separated and each does its job properly.
Building the data architecture: protocols, historians and tag structure
Protocol choice is the first decision that shapes everything downstream. OPC UA is the preferred choice because it carries rich metadata alongside the raw value, letting you tag context (units, quality codes, timestamps) natively. Modbus TCP still runs plenty of legacy PLCs, but it delivers bare register values with no context, so you'll need a translator or metadata layer bolted on to make those tags usable for loss categorisation.
Once data leaves the PLC, route it through a historian or unified namespace rather than pointing your OEE tool directly at the SCADA server. This decouples analytics from control, meaning a slow query or dashboard refresh never touches the machine's real-time loop. It also normalises tags across vendors, so a 15 year old PLC and a brand new line controller can feed the same data model.
Three architectural essentials to lock in before go-live:
- Timestamp synchronisation. Every device syncs to NTP. Without it, a stoppage on one machine can appear to start before the upstream cause on another, corrupting your root-cause analysis.
- Edge buffering. Local buffering at the PLC or gateway prevents data gaps during network drops, so you don't lose the record of a stoppage just because the historian connection blipped.
- Retention policy. Decide upfront how long raw tag data is kept versus aggregated OEE figures, particularly if reporting will ever be audited.
Sample rate matters more than most engineers assume. Field reports and conference research show that increasing scan rate from five seconds to one second often reveals micro-stoppages that were invisible at the slower rate, sometimes shifting calculated OEE by several points on the same line.
Structure your tags around ISA 95 style state models from the start. Run/stop, cycle count, and reject count tags should map cleanly to availability, performance and quality respectively, rather than being retrofitted after the dashboard is already built.
A step by step checklist from discovery to go live
Most integration failures trace back to skipping the boring groundwork. Follow this order:
- Inventory every asset. Record PLC make and model, firmware version, register or tag addresses, and existing protocol support for each machine on the line.
- Map tags to reason codes. Define run/stop states, cycle counters, and reject counts explicitly. A cycle counter that increments on both good and scrap parts, without a separate reject tag, will quietly wreck your quality figure.
- Stage a proof of concept. Pick one line, run the full data path from PLC to dashboard, and validate at your intended sample rate before committing to a plant-wide rollout.
- Run dual-track validation. Compare automated SCADA-derived OEE against manual shift logs for a defined period. Practitioner guidance points to accepting the automated figure once drift stays consistently under 1%.
- Train operators and hand over. Reason-code entry only works if operators understand what each code means and why accuracy matters to them, not just to management.
- Lock in operational safeguards. Proper sensor grounding, debounce logic on noisy signals, NTP sync, and edge buffering all need to be verified in production conditions, not just on the bench.
Pro Tip: Don't skip the dual-track period to save time. A week of manual cross-checking against automated figures is far cheaper than six months of a plant arguing over numbers nobody believes.
Validation, pitfalls, and keeping OEE data auditable
The dual-track method described above isn't a formality. Run manual logging alongside the automated system for long enough to see a full mix of shifts, product changeovers and shift-handover conditions, then compare the totals. Consistent drift under roughly 1% is the commonly cited acceptance bar before you retire the manual process.
Most bad OEE numbers trace back to a small set of repeat offenders:
- Timestamps that aren't synchronised across PLCs, historian, and analytics server
- Sample rates set too low to catch micro-stoppages, especially on fast-cycle equipment
- Heavy OEE calculation logic running inside the SCADA server itself, competing with control tasks
- Loosely defined tag semantics, where a "stop" state means something different on two different lines
The mitigation for each is straightforward once you know to look for it: a dedicated NTP source across the network, sample-rate testing during the proof of concept, a separate analytics server for calculation, and a documented tag dictionary with change control. If OEE figures ever feed regulated reporting, add strict change control and an archival policy so every number can be traced back to its source tag and timestamp months later.
An example of real-time OEE visualisation done well
No-code drag-and-drop modelling changes how fast you can go from tag mapping to a working dashboard. Instead of scripting every gauge and trend line by hand, an engineer maps a PLC tag to a pre-built visual asset from a marketplace and moves to the next machine. Kingfisher 3D SCADA's marketplace of ready-made components works this way, cutting the modelling time that traditionally eats weeks out of an integration project.
Real-time data binding means the 3D scene reflects the SCADA-fed state the moment it changes, not on a delayed refresh. For continuous improvement teams, that immediacy matters: seeing a bottleneck station highlighted the instant it stalls, rather than reading about it in tomorrow's report, is what actually drives shift-level behaviour change.
Practical advantages worth noting for engineering teams evaluating this approach:
- Faster time from tag mapping to a usable operator-facing dashboard
- A component library that removes repetitive manual scene-building work
- Browser-based access, so supervisors can check line status from a tablet on the floor
How SCADA-fed OEE data changes maintenance and scheduling
Once OEE data is reliable, it stops being a scorecard and starts feeding decisions upstream. Maintenance teams get the clearest benefit: cycle-count and reject-rate trends surfaced through SCADA tags flag gradual equipment degradation well before a full breakdown, letting a work order get raised on a slow decline rather than an unplanned stop. That shift, from reactive to condition-informed maintenance, only works if the underlying tag data is trustworthy enough to act on.
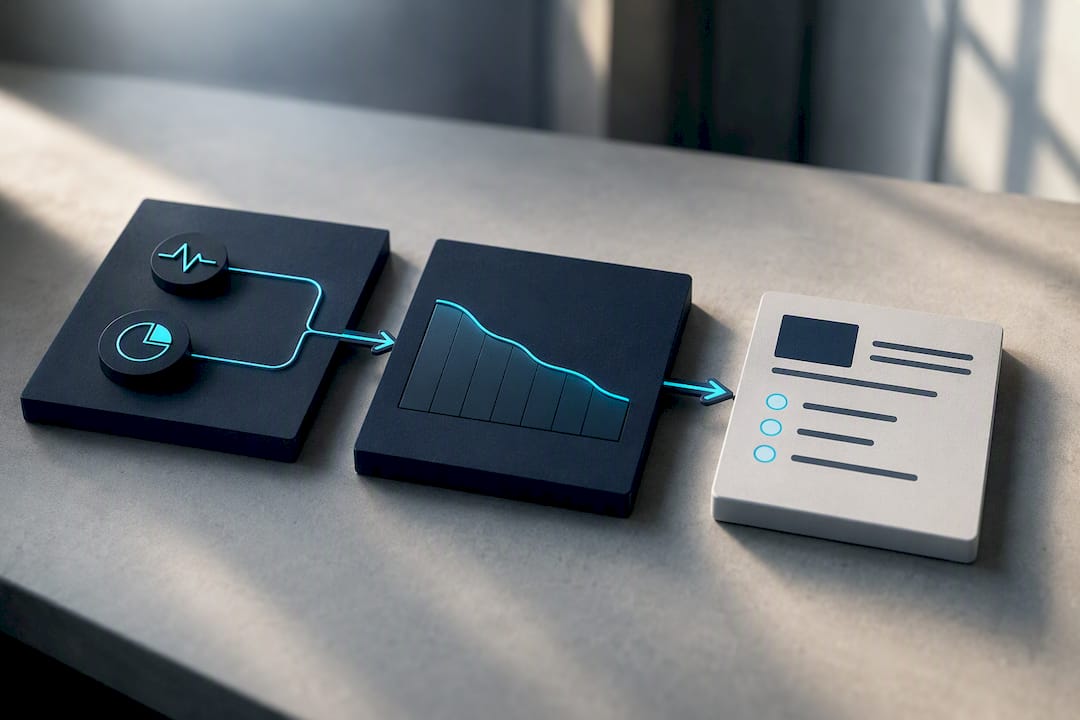
Production scheduling benefits just as directly. Planners who can see actual historical performance, not nameplate capacity, by line and by shift, build schedules that reflect what a line genuinely achieves rather than what its spec sheet claims.
The connection runs both ways. Scheduled maintenance windows logged in a CMMS should show up as planned downtime in the OEE calculation, not as an unexplained availability loss. Get that link wrong and your OEE figures will unfairly penalise a well-maintained line simply because its maintenance schedule wasn't excluded from the loss calculation. Getting it right requires the reason-code structure discussed earlier to include a distinct planned-maintenance category, separate from unplanned downtime, breakdowns, and changeovers.
Choosing between SCADA plus analytics and a dedicated OEE platform
Rapid visibility favours SCADA-fed dashboards; auditability and scale favour a decoupled analytics engine. A unified namespace and vendor-agnostic tag models become decisive the moment you're running more than one PLC vendor or planning to add lines later. My recommendation: pilot on one line, validate against manual logs, then scale outward once the drift numbers hold up.
— Jeffrey Anastacia
Evaluating Kingfisher 3D SCADA for your OEE rollout
If you're building the architecture described above, no-code 3D visualisation removes a lot of the scripting overhead that traditionally slows SCADA projects down. The software lets engineers drag tags onto pre-built assets from a component library, then bind real-time data straight into the scene without writing custom code for every gauge or trend.
That speed matters most during the proof-of-concept phase outlined earlier: you can stand up a working visual model against live OPC UA or historian feeds in days rather than weeks, then use that same environment to run your dual-track validation. It's a practical way to test whether the architecture holds up on your actual line before committing to a plant-wide build.
If you're ready to see it against your own tag structure, the 3D SCADA no-code platform covers a demo pathway, and the smart factory monitoring solution page walks through typical pilot setups for discrete manufacturing lines. Request a demo and bring your PLC list. That's the fastest way to find out whether your existing tags are ready for real-time OEE.
Where these recommendations come from
Sources
- How to calculate OEE from SCADA: a guide for industrial engineers
- SCADA System Integration: A Practical Guide
FAQ
What does 85% OEE mean?
An OEE around 85% is often cited as world-class performance, meaning a line runs at a high combined rate of availability, performance and quality against its theoretical maximum output. Very few real-world lines sustain such performance consistently, which is exactly why accurate, validated data matters more than the number itself.
Is 70% OEE good?
An OEE around 70% is considered typical to solid for many manufacturing operations, generally above average but below world-class. What actually matters is whether the figure is trustworthy: data validated from properly synchronised SCADA systems is more useful than unverified numbers.
What does OEE stand for?
OEE stands for overall equipment effectiveness, a measure combining availability, performance and quality into a single score that reflects how much of a machine's theoretical output is actually achieved.
Is OEE a KPI?
Yes, OEE is one of the most widely used key performance indicators in manufacturing, tracked at machine, line, and plant level. Its value as a KPI depends entirely on the reliability of the underlying SCADA data feeding it, which is why validation against manual benchmarks matters before treating the automated figure as a single source of truth.